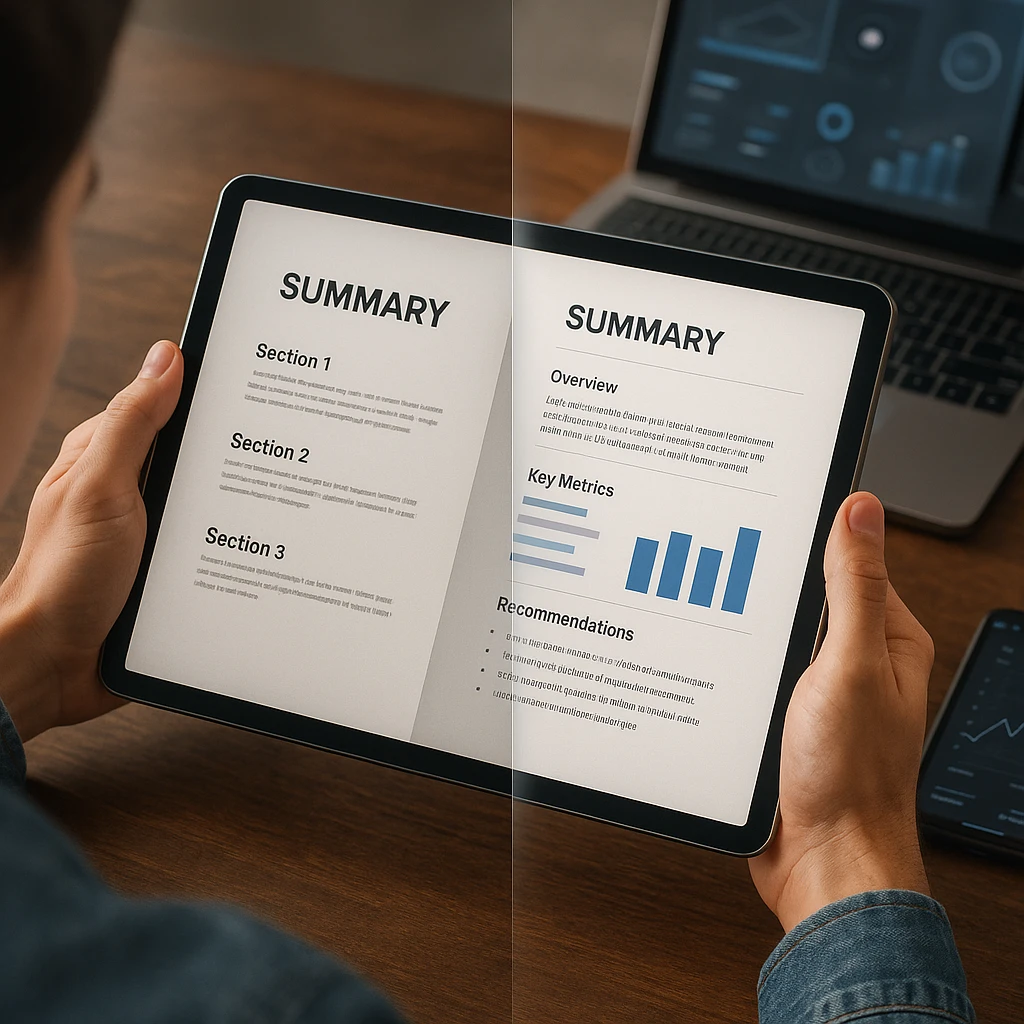
A summary report distills complex information into clear, actionable insights that busy professionals can quickly understand and act upon. Whether you’re presenting quarterly results, project outcomes, or research findings, mastering the art of summary report writing is essential for effective business communication.
This guide shows you exactly how to create compelling summary reports that get read, understood, and acted upon, including proven formats, real-world examples, and professional templates you can use immediately.

What is a Summary Report?
A summary report is a condensed document that presents the key findings, conclusions, and recommendations from a larger body of work. Unlike detailed reports that include extensive data and analysis, summary reports focus on the most important information that decision-makers need to know.
What is summary report used for?
- Executive briefings and board presentations
- Project status updates and milestone reviews
- Research findings and market analysis
- Performance evaluations and quarterly reviews
- Incident reports and compliance documentation
The primary purpose of any summary report is to save time while ensuring critical information reaches the right people in a format they can quickly digest and act upon.
Summary Report Format: Essential Structure
Understanding the proper summary report format ensures your document communicates effectively regardless of the content type or audience.
Standard Summary Report Structure
1. Executive Summary (25% of content) The opening section that captures the most critical points. This section alone should give readers everything they need to understand the main findings and recommendations.
2. Key Findings (40% of content) Present the most important discoveries, results, or outcomes. Use data, statistics, and concrete examples to support each finding.
3. Analysis & Implications (25% of content) Explain what the findings mean for the organization, project, or situation. Connect the dots between data and business impact.
4. Recommendations & Next Steps (10% of content) Provide clear, actionable recommendations based on your findings. Include timelines, responsibilities, and resource requirements when relevant.
Professional Formatting Guidelines
Visual Organization:
- Use clear headings and subheadings for easy navigation
- Include bullet points for lists and key information
- Add charts, graphs, or visuals to illustrate important data
- Maintain consistent formatting throughout the document
Length Considerations:
- Executive summary: 1-2 pages maximum
- Full summary report: 3-8 pages depending on complexity
- Key findings should be scannable in under 5 minutes

How to Write a Summary Report: Step-by-Step Process
How to make a summary report that actually gets read and acted upon requires a systematic approach that prioritizes your audience’s needs and time constraints.
Step 1: Understand Your Audience and Purpose
Before writing a single word, clarify who will read your summary report and what decisions they need to make based on your information. Different audiences require different approaches:
- Executive leadership: Focus on strategic implications and bottom-line impact
- Project teams: Emphasize actionable insights and next steps
- Stakeholders: Highlight progress, challenges, and resource needs
- Compliance officers: Ensure all required elements and documentation are included
Step 2: Gather and Organize Your Source Material
How to summarize a report effectively starts with thorough preparation. When working with large amounts of data, presentations, or documentation, modern tools can significantly streamline this process. The AI Summarizer can help you quickly identify key themes and important points from lengthy source materials, allowing you to focus on analysis rather than data extraction.
Organization strategies:
- Group related information by theme or category
- Identify the most impactful data points and statistics
- Note any conflicting information that needs addressing
- Highlight unexpected findings or surprising results
Step 3: Create a Strong Executive Summary
Your executive summary determines whether busy readers will engage with the rest of your summary report. This section should work as a standalone document that covers all essential points.
Executive summary best practices:
- Lead with your most important finding or recommendation
- Include key metrics, percentages, or financial impacts
- Mention any urgent actions required
- Keep technical jargon to a minimum
- Write this section last, after completing the full report
Step 4: Present Key Findings with Context
Report summary sections should present information logically, moving from general observations to specific details. Each finding should include supporting evidence and explain why it matters.
Effective presentation techniques:
- Start each section with the main conclusion
- Support conclusions with specific data or examples
- Use comparisons to previous periods, benchmarks, or targets
- Address any limitations or caveats in your analysis
Step 5: Develop Actionable Recommendations
Transform your findings into concrete next steps. Strong recommendations specify who should take action, what resources are needed, and when results should be expected.
Summary Report Examples by Type
Business Performance Summary Report
Format structure:
- Executive Summary: Q3 revenue increased 15% year-over-year, driven primarily by new customer acquisition in the enterprise segment
- Key Findings: Customer retention rate improved to 94%, average deal size grew 22%, sales cycle shortened by 8 days
- Analysis: Market expansion strategy is working, but operational capacity may limit Q4 growth
- Recommendations: Increase customer success team by 30%, implement new CRM automation, expand enterprise sales team
Project Status Summary Report
Format structure:
- Executive Summary: Website redesign project is 75% complete, on budget, but 2 weeks behind schedule due to third-party integration delays
- Key Findings: User testing shows 40% improvement in conversion rates, mobile performance increased 60%, accessibility compliance achieved
- Analysis: Delays in payment gateway integration affect launch timeline but don’t impact core functionality
- Recommendations: Negotiate expedited integration timeline, prepare soft launch for beta users, adjust marketing campaign dates
Research Summary Report
Format structure:
- Executive Summary: Customer satisfaction survey reveals 87% satisfaction rate with strong preference for digital service options
- Key Findings: 73% prefer self-service options, response time is top priority, mobile app usage increased 45%
- Analysis: Digital transformation initiatives align with customer preferences and usage patterns
- Recommendations: Expand self-service capabilities, reduce phone support hours, invest in mobile app features

Summary Report Templates and Tools
Creating Efficient Workflows
How to create a summary report efficiently often depends on having the right templates and tools. For organizations dealing with regular reporting cycles, establishing standardized formats saves time and ensures consistency.
Template categories:
- Monthly performance reports: Standardized metrics and KPI tracking
- Project milestone summaries: Progress tracking with visual timelines
- Incident response reports: Structured problem documentation and resolution
- Quarterly business reviews: Comprehensive performance and planning documents
Leveraging Technology for Better Reports
Modern summary report creation benefits significantly from AI-powered tools that can process large amounts of information quickly. When you’re working with video presentations, recorded meetings, or lengthy documents, the AI Summarizer can extract key points and themes, allowing you to focus on analysis and recommendations rather than manual data processing.
Technology advantages:
- Faster processing of source materials
- Consistent identification of key themes
- Reduced risk of missing important information
- More time for strategic analysis and recommendations
Template Customization Guidelines
Summary report format templates should be adapted to your specific industry, audience, and reporting requirements:
- Financial services: Include regulatory compliance sections and risk assessments
- Healthcare: Add patient privacy considerations and clinical outcome metrics
- Technology: Incorporate security assessments and performance benchmarks
- Manufacturing: Include safety metrics and operational efficiency measures
Common Summary Report Mistakes to Avoid
Information Overload
What is a summary report fundamentally about? Clarity and conciseness. Many reports fail because they include too much detail, defeating the purpose of summarization.
Avoid these pitfalls:
- Including every data point from source materials
- Using technical jargon without explanation
- Burying important findings in lengthy paragraphs
- Failing to prioritize information by importance
Weak Recommendations
Strong summary reports don’t just present information—they guide action. Weak recommendations are vague, unrealistic, or fail to connect to the findings.
Recommendation best practices:
- Specify exactly what should be done
- Include realistic timelines and resource requirements
- Assign clear ownership and accountability
- Connect each recommendation to specific findings
Poor Visual Design
Summary report examples that work well use visual elements effectively to enhance comprehension and retention.
Design improvements:
- Use charts and graphs to illustrate trends
- Include callout boxes for critical information
- Apply consistent formatting and branding
- Ensure adequate white space for readability
Advanced Summary Report Techniques
Data Visualization Strategies
Report summary documents become more compelling when data is presented visually. Choose visualization types that best support your message:
- Trend analysis: Line charts for performance over time
- Comparisons: Bar charts for category comparisons
- Proportions: Pie charts for market share or budget allocation
- Relationships: Scatter plots for correlation analysis
Stakeholder-Specific Versions
Consider creating multiple versions of your summary report tailored to different audiences:
- Board version: Strategic focus with financial implications
- Operational version: Tactical details with implementation guidance
- Public version: External communication with appropriate messaging
Integration with Broader Communication Strategy
Summary reports work best as part of a comprehensive communication strategy:
- Follow-up meetings: Schedule discussions to address questions and clarify next steps
- Progress tracking: Establish metrics to monitor recommendation implementation
- Regular updates: Create recurring report schedules for ongoing initiatives
Measuring Summary Report Effectiveness
Reader Engagement Metrics
Track how well your summary reports achieve their intended purpose:
- Read completion rates: Are people reading the entire document?
- Action item completion: Are recommendations being implemented?
- Follow-up questions: What additional information do readers need?
- Decision speed: How quickly are decisions made after report distribution?
Continuous Improvement Process
How to write a summary report effectively improves with practice and feedback:
- Collect reader feedback: Survey recipients about clarity and usefulness
- Track outcome success: Monitor whether recommendations achieve intended results
- Refine templates: Update formats based on what works best for your organization
- Share best practices: Train team members on effective summary report techniques
Conclusion
Mastering summary report writing is essential for professional success in today’s information-rich business environment. The most effective summary reports combine clear structure, compelling data presentation, and actionable recommendations that drive results.
Key success factors:
- Audience focus: Always write for your reader’s needs and time constraints
- Clear structure: Use consistent summary report format that guides readers logically
- Strong findings: Present data with context and explain business implications
- Actionable recommendations: Provide specific next steps with clear ownership
Getting started:
- Choose a summary report template that fits your needs
- Practice with low-stakes reports to develop your skills
- Seek feedback from colleagues and stakeholders
- Continuously refine your approach based on results
Remember, the best summary report is one that gets read, understood, and acted upon. Focus on clarity, relevance, and actionability, and your reports will become valuable tools for driving organizational success.
Frequently Asked Questions
What is a summary report?
A summary report is a condensed document that presents key findings, conclusions, and recommendations from larger bodies of work. It distills complex information into clear, actionable insights that busy professionals can quickly understand and use for decision-making.
What should be included in a summary report format?
A proper summary report format includes four main sections: Executive Summary (25% of content covering critical points), Key Findings (40% presenting important discoveries with supporting data), Analysis & Implications (25% explaining business impact), and Recommendations & Next Steps (10% providing actionable guidance).
How do you write an effective summary report?
How to write a summary report effectively: 1) Understand your audience and purpose, 2) Gather and organize source material systematically, 3) Create a strong executive summary that works as a standalone document, 4) Present key findings with supporting context, and 5) Develop specific, actionable recommendations with clear ownership and timelines.
What’s the difference between a report and a summary report?
A summary report is a condensed version that focuses on key findings and recommendations, while a full report includes comprehensive data, detailed analysis, methodology, and supporting documentation. Summary reports are designed for quick consumption by busy decision-makers.
How long should a summary report be?
A summary report should typically be 3-8 pages depending on complexity, with the executive summary limited to 1-2 pages maximum. The key findings should be scannable in under 5 minutes, and the entire document should be readable in 15-20 minutes.
What are some good summary report examples?
Summary report examples include business performance reports (quarterly revenue and KPI updates), project status reports (milestone progress and timeline updates), research summary reports (survey findings and market analysis), and incident reports (problem documentation and resolution steps).
How do you format a professional summary report?
Professional summary report format uses clear headings and subheadings, bullet points for key information, consistent formatting throughout, adequate white space for readability, and visual elements like charts or graphs to illustrate important data and trends.
What tools can help create better summary reports?
Modern summary report creation benefits from templates for consistency, data visualization tools for charts and graphs, collaborative platforms for team input, and AI-powered tools that can quickly process large amounts of source material to identify key themes and findings.
How do you make summary reports more engaging?
Make summary reports more engaging by leading with your most important finding, using visual elements to break up text, including specific data and concrete examples, writing in active voice, and focusing on implications and actions rather than just presenting raw information.
What are common summary report mistakes to avoid?
Common mistakes include information overload (including too much detail), weak recommendations (being vague or unrealistic), poor visual design (inconsistent formatting, no white space), burying important findings in lengthy paragraphs, and failing to tailor content to the specific audience’s needs and time constraints.


